Data Pipeline Monitor
A working simulation of the pipelines I build. Messy files go in, clean reports come out, and you control what the rules are allowed to fix.
The idea
Almost every business has a person, or several, whose week includes rebuilding the same report. A supplier sends a price list with the dates in three formats. A bank export arrives with amounts in brackets. Timesheets come back with hours written as “7h30”. Someone copies, fixes and checks, then does it all again next week.
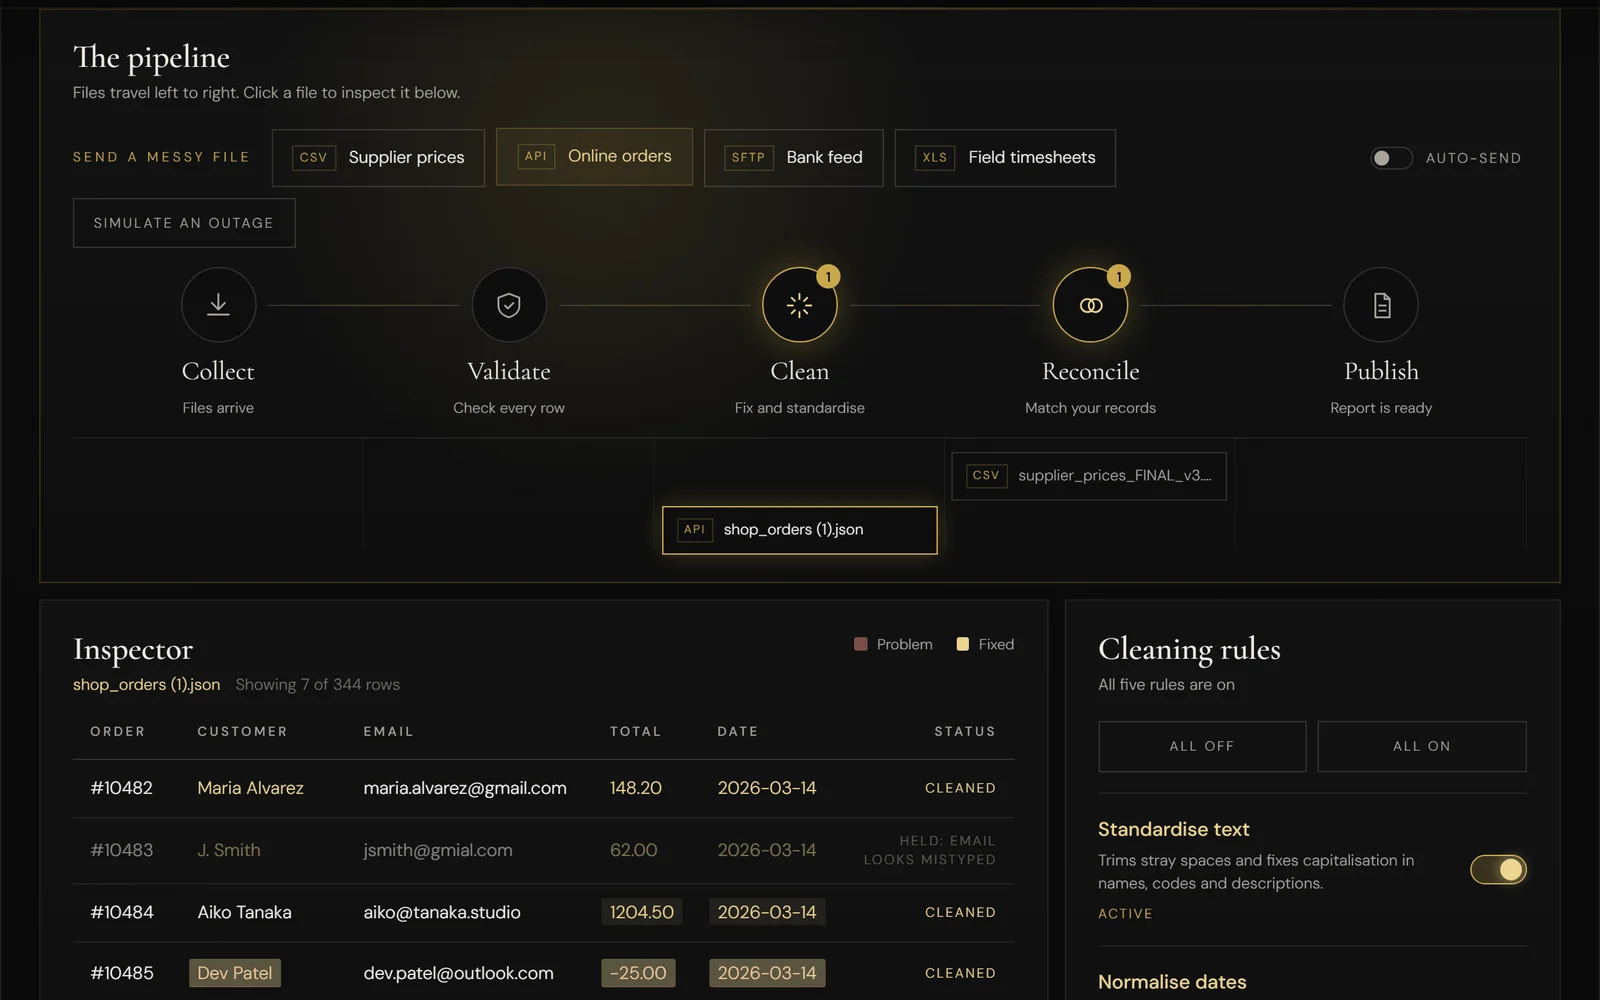
This demo shows the alternative. It simulates a small wholesaler receiving four kinds of untidy files, and puts a monitor in front of the pipeline that handles them: each file is collected, validated, cleaned, reconciled against the company’s own records and published as a finished report.
What to try
- Watch a file travel. Files move through five stages. Click any file to inspect it. Problems appear in red, then turn gold as they are fixed, one row at a time.
- Switch a rule off. Turn off “Normalise dates” or “Remove duplicates” and send another file. The problems now reach the report, the data quality score drops, and the activity log tells you exactly what happened.
- Break a connection. Press “Simulate an outage” and send a file. The pipeline retries with growing waits, raises alerts, and recovers on its own when the connection returns.
- Send your own mix. Four sources behave differently: supplier prices, online orders, a bank feed and field timesheets.
How it is built
Everything on the page is written from scratch in TypeScript, with no libraries. A small scheduler moves each file through its stages in real time, the inspector table is driven by the same state, and the numbers ease toward their targets. The simulation pauses when you scroll away or switch tabs, and it respects the reduced-motion setting.
What it demonstrates
- Reliable by design. Every file is checked against the same rules, every time, with nothing left to memory or mood.
- Honest about doubt. Records with missing or suspicious values are held back for review instead of being guessed at, so a finished report can be trusted.
- Failure handled calmly. Retries, recovery and clear alerts are part of the design from the start, not an afterthought.
- Measured return. The report card compares the time a run takes with an estimate of doing the same job by hand. The estimate is deliberately labelled as illustrative.
About the data
The company, the files, the people and every figure are invented. Nothing here is drawn from a real organisation, and the code was written specifically for this site.